Recognizing unsupported queries
What this example reviews
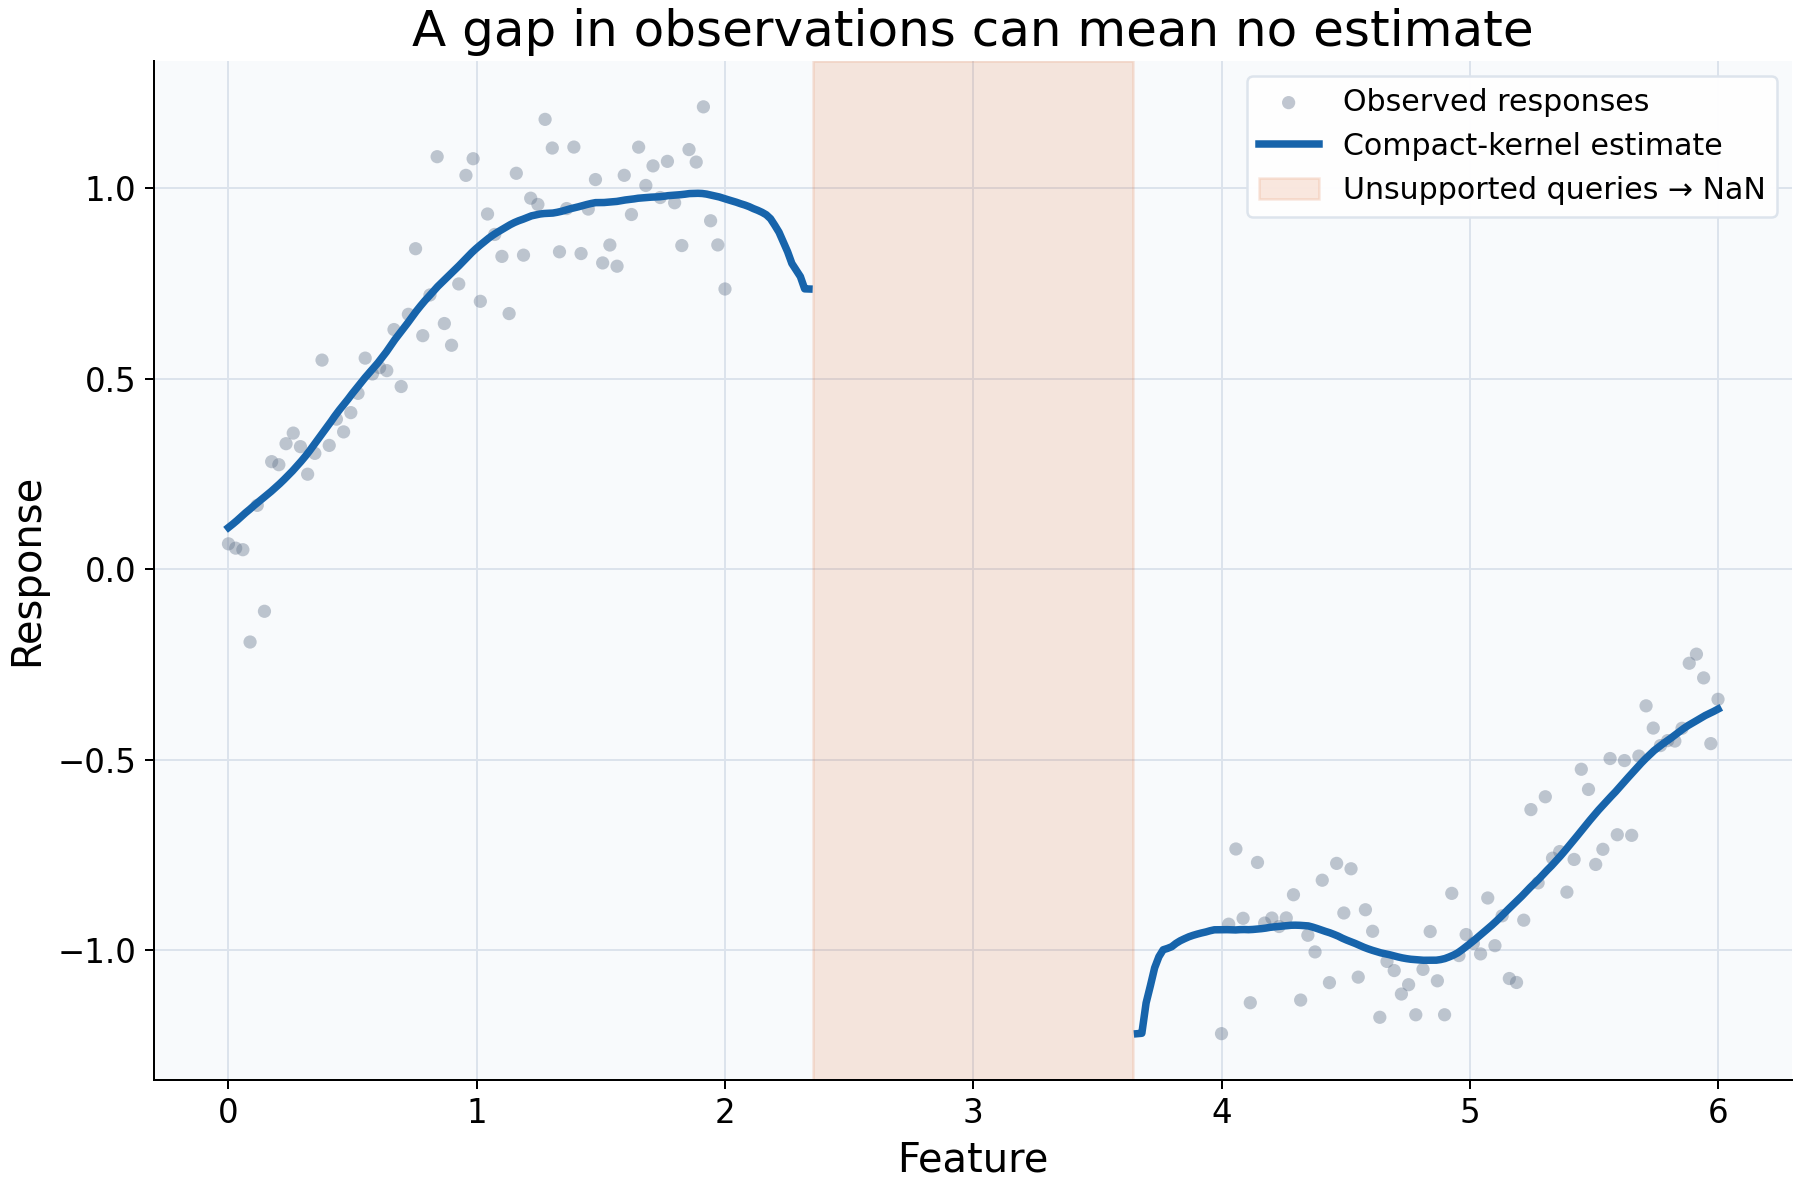
This example reviews whether a query has enough local information to produce any estimate. Training features occupy 0-2 and 4-6, leaving a deliberate gap. An Epanechnikov kernel with bandwidth 0.35 has compact support, so it cannot reach training observations from the middle of that gap.
Choices and their impact
| Item | What is being reviewed | Impact and interpretation |
|---|---|---|
| Gray observations | Where feature/response pairs are actually available | The empty middle is a lack of observations, not merely a visual omission. |
| Blue curve segments | Queries with positive numerical kernel support | Predictions are drawn where observations contribute to the local fit. |
| Broken line | Unsupported predictions retained as NaN | No interpolation is added to hide missing estimates. Query rows remain in the diagnostic table. |
| Orange region | Locations flagged as unsupported | Distinguishes absence of an estimate from an estimate with high error. |
| Bandwidth 0.35 and compact kernel | The distance within which rows may contribute | Changing either setting changes the support geometry as well as the fitted curve. |
| Overall training range | Minimum and maximum observed feature values | All displayed queries are inside this range, but some are still unsupported. Range membership and local support are different checks. |
Interpreting the plot
Read the break in the curve as missing information under the configured model, not as a zero response or an abrupt change in the relationship. The estimator returns NaN for those queries; Matplotlib leaves a break rather than connecting supported endpoints through the empty region.
The script suppresses only the expected SupportWarning within this deliberately
constructed example because the missing support is explicitly displayed. It does
not replace NaNs, drop rows, or disable validation. In an analysis pipeline,
inspect supported and in_training_range before interpreting or scoring predictions.
When this is useful
Use support diagnostics when features have gaps, tails are sparsely sampled, subgroup ranges differ, or a scorer encounters NaN predictions. This distinguishes a parameter choice that cannot estimate a query from a numerical curve that merely looks smooth.
A Gaussian kernel or larger bandwidth may give finite predictions through the gap. That would change the pooling assumption, not supply missing observations or prove that the estimated relationship is reliable there. Finite coverage is a computational requirement, not an accuracy guarantee.
Explore further
Try a smaller bandwidth and observe where the gap widens. Try a Gaussian kernel,
then inspect its local weights in the gap. Set unsupported="raise" to fail
explicitly when a downstream prediction task requires every query to be supported.
Run this example
From the checkout, with rgram[plot] installed:
python examples/plot_relationships.py --example support
# Save just this figure without opening a desktop window:
python examples/plot_relationships.py --example support --output-dir /tmp/rgram-figures
Download this standalone example.
The complete code below includes imports, data, configuration, and plotting.
Run the downloaded file with python support.py.
from __future__ import annotations

import argparse
from pathlib import Path
from typing import TYPE_CHECKING
import warnings

import numpy as np

from rgram import KernelSmoother, Regressogram, SupportWarning, quantile

if TYPE_CHECKING:
    from matplotlib.axes import Axes
    from matplotlib.figure import Figure

# A consistent palette makes comparisons readable across the gallery.
COLORS = ["#1764ab", "#de682b", "#21856b", "#8855a2"]


def _create_axes(
    title: str, xlabel: str = "Feature", ylabel: str = "Response"
) -> tuple[Figure, Axes]:
    """Create a readable, single-panel figure with consistent gallery styling."""
    import matplotlib.pyplot as plt

    with plt.rc_context({"font.size": 14, "axes.labelsize": 16, "axes.titlesize": 20}):
        figure, ax = plt.subplots(figsize=(10, 6.6), layout="constrained")
        ax.set(title=title, xlabel=xlabel, ylabel=ylabel)
    ax.set_facecolor("#f8fafc")
    ax.grid(color="#dce3ec", linewidth=0.8)
    ax.set_axisbelow(True)
    ax.spines[["top", "right"]].set_visible(False)
    ax.tick_params(labelsize=13)
    return figure, ax


def _plot_observations(ax: Axes, X: np.ndarray, y: np.ndarray) -> None:
    """Show original rows without connecting them or hiding response spread."""
    ax.scatter(
        X,
        y,
        color="#64748b",
        alpha=0.4,
        s=28,
        edgecolors="none",
        label="Observed responses",
    )


def _add_legend(ax: Axes) -> None:
    """Identify every plotted comparison using the same readable legend style."""
    ax.legend(fontsize=12, framealpha=0.96, edgecolor="#dce3ec", loc="best")


def _gaussian_smoother(bandwidth: float, **kwargs) -> KernelSmoother:
    """Keep kernel and bandwidth units explicit; kwargs select other model options."""
    return KernelSmoother(
        kernel="gaussian", bandwidth="manual", bandwidth_value=bandwidth, **kwargs
    )


def support() -> Figure:
    """Expose a feature gap rather than drawing a supported curve across it."""
    rng = np.random.default_rng(23)
    # Leave a deliberate gap: no observations are available between 2 and 4.
    X = np.r_[np.linspace(0, 2, 70), np.linspace(4, 6, 70)]
    y = np.sin(X) + rng.normal(0, 0.12, len(X))
    query = np.linspace(0, 6, 350)
    # This compact kernel reaches at most 0.35 feature units from a query.
    model = KernelSmoother(
        kernel="epanechnikov", bandwidth="manual", bandwidth_value=0.35
    ).fit(X, y)
    # Suppress only the expected support advisory; the orange region and broken
    # line make those unsupported rows explicit, and NaN values are retained.
    with warnings.catch_warnings():
        warnings.simplefilter(
            "ignore", SupportWarning
        )  # Gap is highlighted explicitly below.
        diagnostic = model.predict_diagnostics(query)
    # Query support is distinct from being inside the overall training range.
    unsupported = ~diagnostic["supported"].to_numpy()
    figure, ax = _create_axes("A gap in observations can mean no estimate")
    _plot_observations(ax, X, y)
    ax.plot(
        query,
        diagnostic["prediction"].to_numpy(),
        color=COLORS[0],
        lw=3,
        label="Compact-kernel estimate",
    )
    ax.axvspan(
        query[unsupported].min(),
        query[unsupported].max(),
        color=COLORS[1],
        alpha=0.15,
        label="Unsupported queries → NaN",
    )
    _add_legend(ax)
    return figure

if __name__ == "__main__":
    import matplotlib.pyplot as plt

    figure = support()
    plt.show()
    plt.close(figure)